We talk a lot about the need to take a long-term view when investing for the future. We also know this isn’t always easy, especially when there’s so much happening in the world.
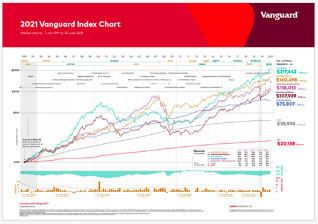
To help keep things in perspective, we’d like to share Vanguard’s 2021 Index Chart, which shows the long-term performance of different asset classes. The chart powerfully illustrates that, while markets fluctuate day to day—and even year to year—asset values have steadily increased over the last 30 years.
I encourage you to take a few minutes to view the 2021 Vanguard Index Chart by visiting:
You might also want to check out some of Vanguard’s additional resources, including:
- A short video animation that brings the Index Chart to life.
- Useful flyers that explain the benefits of diversification and a long-term plan.
- Smart Investing articles offering different perspectives on diversification and long-term investment strategies.
If you have any questions about the 2021 Vanguard Index Chart or wish to discuss your own investment strategy and long-term goals, please feel free to contact the IM Team by emailing us at support@inspiredmoney.com.au or calling 08 6222 7909 to arrange a convenient time for a personalised conversation.